Category Archives: Education

Semester

From the Tortured Biochemists Department

It’s the end of the semester. Here’s a song parody for some much-needed levity.

I was supposed to graduate

But degree audit said biochemistry

I was a [insert relevant degree]

And there was a degree requirement

All of this to say I hope you’re okay

But I’m the reason

And no one here’s to blame

But what about procrastination?

And for one semester, we were biochemists

Email you sometimes, ask about the enzymes

Now you’re moving on, turned into engineers

Dr. Roose’s exams, I wanna kill her1

All those assignments stuck on a single protein structure2

I only crammed for Exam 1, the effects were temporary

Biochemistry, it’s ruining3 my life

Biochem, it’s ruining my life

I taught you for one semester

I learned you, but I learned you

And for a semester, we were biochemists

Email you sometimes, ask about the enzymes

Now you’re moving on, turned to engineers

Dr. Roose’s exams, I wanna kill her

And for a semester, we were biochemists

Email you sometimes, ask about my pathway

Now you’re at Himes Hall, which answer is it?

My students aren’t cheating, I wanna pass them

Biochem, it’s ruining my life

Biochem, it’s ruining my life

I taught you for one semester

I learned you, I learned you

Biochem, it’s ruining my life

Biochem, it’s ruining my life

I taught you for one semester

I learned you, I learned you

Thought of emailing ya but you won’t respond

‘Nother semester passed at LSU

Graduate and have the life you want

But it won’t begin til I learn biochem

Thought of emailing ya but you won’t respond

‘Nother semester passed at LSU

Graduate and have the life you want

But it won’t begin til I learn biochem

For your reference:

  1. I’m perfectly safe. It’s a parody. We joke in class about my evil multiple choice questions. ↩︎
  2. Hopefully, I’ll have time to write about this soon. ↩︎
  3. Hopefully too strong a word, but again, it’s a joke. ↩︎

Could you, would you teach online?

By Dr. Roose


Could you, would you teach online?

Really? I just had to whine.


Yes, from a social distance.

It’s really university insistence.


I like my students in the lab,

I must generate data for them to grab.


It will be great, you’ll all see!

You will still learn biochemistry.


I can teach it here or there,

With Coronavirus everywhere.


I can teach near or far,

I can teach it from a car.


I can teach it from my house

If my dogs can be quiet as a mouse.


If you’ll all connect to Zoom,

I can teach from my living room.


Everyone plug in your machine,

We can all learn during quarantine.


With this virus so concerning,

We all so love online learning.


It will be great and you will see,

Still getting your degree.


Dr. Roose can teach online.

Stay calm. It will be just fine.

Writing the Discussion/Conclusion Section

This was part of a series of writing tutorials I wrote for my students. This series is compiled on the page A Beginner’s Guide to Writing Scientific Manuscripts.

The Discussion/Conclusions section is where you synthesize the information from multiple experiments into some new insights and make connections with the wider research world. Journals differ significantly in their formats for Discussion/Conclusions and Results. Some journals combine the Results and Conclusions sections so that you can incorporate the broader significance of your results as you write them. With this style, there may also be a very short (1-2 paragraphs) section dedicated to pure ‘Discussion’ where authors can make other connections to their research field. In the absence of this as an official section, authors typically use their final paragraph to reiterate the main points of the work, what they mean for new knowledge in the field and what outstanding questions remain. Other journals will have a dedicated Discussion/Conclusions section that is separate from the Results section. In this section, you have more space to write about the significance of your results. You should include references to other related studies for comparison and contrast to your conclusions. If there are any outstanding questions left by your research or obvious future directions, you can dedicate the very end of your manuscript to writing about that.

In either format, this is the last substantive writing that your audience will read. It is important that you package your work in some coherent way (new model, refuting a hypothesis, etc) so that the reader will understand the same accomplishment. It is important to strike the proper balance when interpreting your data and incorporating it into the larger knowledgebase of your scholarly field.

A weak Discussion/Conclusion section can leave the reader wondering why they started reading the article in the first place. “So, what?” This is not the way you want others to feel about _X_ years-worth of work on your part. Remember that your first readers are reviewers to decide your manuscript’s publication-worthiness. If they can’t figure out why they read this manuscript (other than the fact that they were assigned to by the editor), then they won’t want others to read it either, at least not without major revisions). You may have a particular interpretation of your data, but if it is poorly articulated or not explicitly stated, then your readers will be left to do this on their own. When this happens, your readers will begin to ask questions like, “Why didn’t you do this experiment?” In some cases, this is a perfectly valid point and you should’ve done that experiment. In other cases, their questions and other possible conclusions are not warranted because you should have more clearly explained how your controls or previous literature argue against certain interpretations.

At the other end of the spectrum, over-reaching your data and making grand interpretations that extend beyond what you have actually shown can also get you into trouble. As fellow scholars in your field with finely-tuned BS-meters, your reviewers will call you out on egregious cases of over-interpretation. This will usually come in the form of requests for numerous, difficult and time-consuming experimentation. If you want to make bold claims, you have to prove it. If you are ready to publish, you need to rein in your writing and tone down your claims. Research always continues, so it is reasonable to stand by a decision that enough experimentation has been done to form a publishable manuscript. Just make sure that any planned future experiments or outstanding questions that you raise aren’t critical to the work at hand. If more than one reviewer disagrees with you about your arbitrary stopping point, then you really should get back to the bench and collect more data.

Ideally, the Discussion/Conclusion section should tell the story you intended when you put your figures together. By this time in the process, you’ve finally found your groove for writing and it’s important to check yourself to see if you’ve found the right balance. Re-read the first draft of your Discussion/Conclusions section with fresh eyes alongside the figures with supporting data and look for any potential weaknesses. Should you do additional experiments or include other controls? Should you clarify your claims? Should you tone them down? Is there any other relevant literature that you should cite to facilitate interpretation? In the end, you should strike the proper balance so that your work is significant and interesting within the boundaries of sound data. Your reviewers will inevitably find something they would like you to change, either with writing or experimentation, but you should do your best to avoid baiting them right out of the gate. Even if you are making a conscious effort to objectively review your Discussion/Conclusions section, as an author you are biased and too close to your own data to see some potential flaws. Have another colleague outside the author list look it over prior to submission for publication.

One final note on grammatical formatting…

For this section, you can carefully marry past and present tense. When referring to specific data or experiments (which you will do only briefly; no need to completely repeat everything from the results section), use the past tense. When describing what it means in a bigger context, these things are true, will always be true and you can use the present tense. Grammar and clear writing are essential in all sections of your manuscript, but meticulous wording is critical for this section to avoid confusion about data vs. interpretation and past vs. present work.

Johnna

Pyramid of Biochemistry Greatness

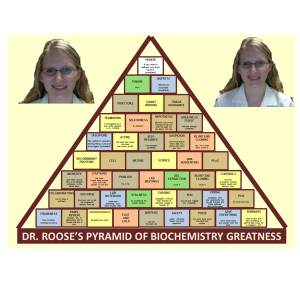
As I mentioned in my previous post, there’s at least one person in the world searching the internet with the phrase ‘everything aspiring biochemists should know.’ I feel obligated to share my pyramid for biochemist success. It’s based on Ron Swanson’s perfectly calibrated recipe for personal achievement. Click this link for context if you are not familiar with Parks and Rec.

Pyramid

Here is a link to the PDF with a little better resolution. Now, go achieve your dreams. I would say good luck, but as Ron says, “Luck is a concept created by the weak to explain their failures.”

Johnna

Writing the Results Section

//This is part of a series of tutorials I wrote for my students. Toward the end of the semester as deadlines were looming, they became more specific for the assignment in my course. So it’s taken me a while to modify them. Since part of this series got picked up over at the Addgene.org blog, I feel like I should really finish up this series. This series is compiled on the page A Beginner’s Guide to Writing Scientific Manuscripts.//

The results section is the main course of your manuscript. This is where you lay out all of your data in carefully arranged figures to build the case for your conclusions. Since you have already decided what data get to leave the pages of your lab notebook and have rendered them as informative figures, the majority of the work of your results section is finished.

General

The results section is written in the past tense because you are describing experiments performed and observations made previously. “The ADH purification procedure gave a 6-fold purification with a 20% yield.” In some contexts, your results will yield new truths about ADH, which will always be true. It would be appropriate to use the present tense in these contexts, but be careful how you do this. It is generally easier to restrict results to the past tense and save the new insights for the discussion section where they can be mentioned in the present tense. The reason for this is purely grammatical because it takes some practice to successfully blend tenses within sections/paragraphs without it turning into a hot mess.

Your figures and tables frame your story

The order of your figures is usually not the chronological order in which you did the experiments. Care should be taken in arranging your figures in an order that will best support your conclusions. The first figures typically describe the experimental system and its verification (creation and validation of a mutant, isolation of a protein, demonstration of a new analytical method etc). Subsequent figures show the application of the experimental system to a relevant question to generate new knowledge. These can be used to build evidence for a particular model of how you think something works or to eliminate possible explanations. Either way, the order of your figures should take the reader through a logical sequence that will culminate in your conclusions.

Tell the story

Once you have laid the groundwork with your properly assembled figure sequence, the text of your results section should guide the read reader through each figure and how your data lead you to new knowledge of your research topic. If your writing takes strange circuits or you have difficulty in transitioning between sections, you may want to re-think the order of your figures. It typically means there is some conflict between the data in your figures and the way you want to write about it. Speaking of sections, it is often useful to break up the text of your results into useful sections with headings that describe the analysis or main conclusion from the results.

While your figures should be clearly understandable with legends to describe what the reader is looking at, the text in your results section should give the context for that data and highlight the key findings. When you refer to your data, refer to them by their figure (and panel) or table number. Since you have multiple gels and graphs, you cannot just refer to them generically by experiment type without designating a specific figure without causing confusion. Also, it is more succinct to say ‘Figure 5A’ vs. ‘the graph of absorbance/activity vs. elution volume.’ In the context of the assembled manuscript, the figures and their legends will be pages and pages ahead of the results section. So, you must direct the reader to the proper place. In the final version of the manuscript that actually gets published, the figures will be re-sized and type-set into journal pages where they are closer to their results text, but never assume that your reader will be able to pick out the proper panel of a figure on their own.

Methods context and purpose

To set up the descriptions of your figures and what they possibly mean, it is important to give some context for the experiment. Describe the purpose for the experiment. The data in your figures should accomplish this purpose and you must describe how so in the text of your results section. Remember also that the details of the methods used will likely be pages and pages previous, so it’s perfectly acceptable to reiterate some method highlights for context, especially if they are important for interpreting the data in your figures. You should be able to read your results paragraphs and have a good understanding of what is being done without having to flip back to the methods section.

Discussion within the results section

How much discussion you include in your ‘results’ section will vary depending on the journal for which you are submitting your manuscript. Some journals have a separate discussion section where you are allowed a designated space to expound upon the meaning of your results in a larger context, outstanding questions, links to previous studies etc. In this case, keep your results section focused on the data at hand. Don’t dwell too much on implications or what the results may mean unless those conclusions transition into your next figure. If there is no separate discussion section, then write your conclusions where appropriate, but overall your writing should still stay grounded in your data. Too much elaboration is a symptom of over-interpreting your results and reaching beyond what the data actually means. Stick to the facts and qualify the conclusions where appropriate. It’s always a good idea to connect your work to other studies, but too much may again be stretching your data more than is necessary. Too many conclusions or integrating your work into a complex model at the end also risks a call for additional experimentation by the reviewers that get the first look at your manuscript. If your data along with previously published work doesn’t support every aspect of your conclusions, they maybe you should do some more work in the lab. If that suggestion just made you throw up in your mouth a little, then maybe you should be more conservative in the interpretation of your results.

Johnna

Becoming Real

I’ve been in my new teaching position for an academic year now. It has been quite the transition from my research position as a postdoc. Because of the designed transient nature of research training as a graduate student and a postdoc, I’ve often joked about not being ‘Real’ for quite some time. The elusive career path of many PhDs seems to be filled with the same question as the Velveteen Rabbit in the tale by Margery Williams.

“What is REAL?” asked the Rabbit one day.

There has been much discussion about what this means for a career in science these days. It used to only mean one thing- a tenure-track position at a research university. However, more often that path is less traveled, only the fantasy of whispered voices among labs of senior members who were fortunate (?) enough to be raptured away to the ranks of assistant professors. The majority of us are still working out what it means to be real in terms of career and still live with ourselves as human beings. I am still on that path, but the way seems to be clearing.

THERE was once a velveteen rabbit, and in the beginning he was really splendid.

I love research and working with my hands in the lab. I’m very good technically at performing biochemical experiments. I like developing new experiments to answer questions stemming from previous results. I even like meticulously assembling publications from my results; there are not many details I miss in the instructions for authors. I can graciously respond to reviewers’ comments. While I do fewer of these things today, all of these things are still true for me. Despite years of tedious experimental drudgery and the inevitable walls you encounter during research, I still say that I enjoy it, but the systematic practice of research wears down even the tenacious. Eventually, you realize you are not new and splendid any more, but you are not yet real.

“Real isn’t how you are made,” said the Skin Horse. “It’s a thing that happens to you. When a child loves you for a long, long time, not just to play with, but REALLY loves you, then you become Real.”

The Skin Horse has some good advice for PhDs. It isn’t how we are made. There isn’t a single formula that we should all be following. This is terribly disappointing for someone like me that so enjoys checking items off of to-do lists. If only I could accomplish all these tasks and then I would be real. However, it doesn’t just happen to you either. You have to be an active participant. At some point, you must make a decision and take some risks. Real involves risk. For me, it was leaving a research career for something my training had only minimally prepared me for- teaching.

“Does it hurt?” asked the Rabbit.

“Sometimes,” said the Skin Horse, for he was always truthful. “When you are Real you don’t mind being hurt.”

Risk means you could get hurt. Of course, I run a tight ship around the lab (even more so in the teaching lab) so there was little chance of actual physical pain in my transition to teaching. Nevertheless, there was a steep learning curve for figuring out time management in a teaching position. The feedback from my students has been rewarding so that weakens the memories of late-night grading sessions and last-minute-laboratory-troubleshooting.

“Does it happen all at once, like being wound up,” he asked, “or bit by bit?”

“It doesn’t happen all at once,” said the Skin Horse. “You become.”

“It takes a long time. That’s why it doesn’t happen often to people who break easily, or have sharp edges, or who have to be carefully kept. Generally, by the time you are Real, most of your hair has been loved off, and your eyes drop out and you get loose in the joints and very shabby. But these things don’t matter at all, because once you are Real you can’t be ugly, except to people who don’t understand.”

I’ve only been in my current position for an academic year now. The jury is still out on real, but I am becoming. No matter the career choice (teaching, tenure-track, private, start-up, other altac) if you have a PhD, you are not someone that must be carefully kept. If you are happy in the career choice that has made you real, then you can never be ugly, ‘except to people who don’t understand.’

And so time went on, and the little Rabbit was very happy–so happy that he never noticed how his beautiful velveteen fur was getting shabbier and shabbier, and his tail becoming unsewn, and all the pink rubbed off his nose where the Boy had kissed him.

I have been surprisingly happy in my instructor position, but I am quite certain the teaching has given me a new wrinkle or two. I furrow my eyebrows together much more in my new position puzzling over the interpretations of instructions by my students than I ever did interpreting the results of new research. I also have an eye-twitch at the thought of grading some assignments. Thankfully, my blonde hair has resisted any grays up to this point, but I may not be able to stave them off for many more semesters. I really haven’t noticed these changes too much, and I’m sure I will lose a few more whiskers along the way.

“He doesn’t smell right!” he exclaimed. “He isn’t a rabbit at all! He isn’t real!”

“I am Real!” said the little Rabbit. “I am Real! The Boy said so!” And he nearly began to cry.

The students call me ‘Dr. Roose’ and even sometimes ‘Professor.’ Remembering to answer to these titles was the strangest part of the transition into my new role. In my head, imposter syndrome raised doubts. “A real instructor would have already made that presentation. A real teacher would have worded that question more clearly. A real professor would have graded those exams by now.” I just took it day by day, but sometimes I still felt like the rabbit yelling into the wind. “I am real! I have a laser pointer and a remote slide-changer. I wrote a syllabus! I use Moodle!” I’m sure I’m not the only PhD on a career path with delusions of insufficiency. The truth is, we are simultaneously none of us real and all of us real. You just get up every day and become as best you can and that’s real enough for today.

“Wasn’t I Real before?” asked the little Rabbit.

“You were Real to the Boy,” the Fairy said, “because he loved you. Now you shall be Real to every one.”

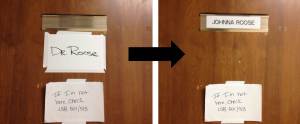
No, my tears this year did not conjure a nursery magic fairy to restore my wrinkles. Teaching has not suddenly become easy and perfect. As much as I thought I was real getting through two semesters, I have more improvements that I would like to try for the future. Given the budget climate for higher education in my state, I (like the Velveteen Rabbit) am just glad to have escaped being burned with the garbage pile. However, the Department did make me real to everyone in one way- my very own legitimate name plate for my office door. Becoming real indeed.

Door

He was a Real Rabbit at last, at home with the other rabbits.

Links

http://digital.library.upenn.edu/women/williams/rabbit/rabbit.html

Biochemistry Casino: Glycolysis Black Jack

“Money won is twice as sweet as money earned.” The Color of Money

Teaching has kept me busy since my last post. The days leading up to midterms, the grading and the office visits by concerned students in the aftermath have been too full for blog writing. In my biochemistry lecture course, the students and I are making our way through the core metabolic pathways, and I’m trying to come up with creative ways of getting the main ideas across.

 First stop: Glycolysis Blackjack

Glycolysis is a universal metabolic pathway for all organisms that consume glucose. (Yes, that includes plants. They just happen to make their own glucose from sunlight and CO2 instead of eating other organisms.) As far as energy-yielding pathways go, it’s not that complex. Glucose molecules are converted to pyruvate yielding a net of 2 ATP molecules. However, the names of the enzymes and the metabolic intermediates all start to sound the same and it’s easy to get lost in the details. Here’s an analogy to keep the overall picture in mind.

ATP is often referred to as the biochemical cash of the cell. The simplest game to win some ATP is at the glycolysis black jack table.

First, you have to pay to play. Invest an ATP to get your cards.

ATP

Congratulations! Glucose-6-Phosphate is just like being dealt a pair of aces.

Aces

If you’re dealt this hand at any casino biochemistry or otherwise, your next move is to split those cards into two hands. (You’ve either got 2 or 12 and the chances of you beating the dealer are much better if you know you are starting with an ace.) As in any casino, you have to pay to split; so you invest another ATP. In glycolysis, you’re splitting a 6 carbon sugar into 2 3-carbon molecules (glyceraldehyde 3-phosphate).

ATP

splitaces

In this contrived situation at the biochemistry casino, betting is limited to your investment. However, when you get your second card for both of your hands, you get jacks. Black jack on both hands. You win! Your winnings on one hand mean you break-even on your investment. Your winnings on the other hand mean you net back your initial investment (2 ATP). In glycolysis, the two molecules of glyceraldehyde 3-phosphate can each be used to yield 2 ATP molecules, giving a net of 2 ATP from glucose.

winnings

Sure, it’s not the drama of winning at slots, roulette or the lottery. But at this casino, you always get these cards. If you can ante in the first ATP molecule, you’ll get a pair of aces. If you can ante in the second ATP, you can split them and get jacks and double your investment. Every. Time. Sure, betting is limited, but if you’re guaranteed to win, you would sit at that table all day and all night. And you do. Eventually, you take those winnings and those cards to another table with higher stakes, but that will be a separate analogy. Other organisms make a perfectly good living at this table alone using glycolysis coupled with fermentation.

Of course, there isn’t a money casino in the world that works this way. The house always wins. But you should really split those aces when you get them. That’s still good advice.

Here’s a link to the BiochemistryBlackJack Powerpoint slide with animation if you’re interested in using the analogy.

Johnna

A special thanks to my husband SuperChef for patiently explaining the finer details of blackjack to me to make this analogy work.

Figures and Figure Legends

This is part of a series of tutorials I’m putting together for my students. This series is compiled on the page A Beginner’s Guide to Writing Scientific Manuscripts.

So, you have collected some interesting data from your experiments. Since no one but you will be reading your lab notebook (but hopefully people could if they wanted to), you need to present that data in figures so the rest of the world can know what you did and decipher your results.

Deciding what data gets to be a manuscript figure

The purpose of your manuscript is to show evidence for a new conclusion and the data presented in your figures should tell this story. Remember, the order of your figures for your manuscript may not necessarily (and probably won’t be) the order in which you collected the data. So, once you have all of your figures assembled, print them out one per page and work on defining the best order of presentation to make the case for your new conclusion. Now is a good time to evaluate whether there are any potential weaknesses regarding support for your conclusions, either in the data you already have or data you may still need to collect. You want to present the strongest possible case before your manuscript is submitted for review, but everything is a cost-benefit analysis and you’re always against the clock.

At this point you may also notice that some of the data presented in figures may be tangential, not quite fit with the rest or break up the flow of the story you are trying to tell. Authors can decide to cull certain figures (Sorry, data you have to remain in the lab notebook) or move them to ‘Supplementary Figures.’ Many journals allow for the inclusion of Supplementary Material- extra figures, longer versions of methods, large tables of data or files that would never be appropriate for print format. These Supplementary Materials exist as electronic files only linked to your final accepted manuscript as it appears as a journal article. Each journal has a different policy for what is acceptable for Supplementary Material. Some are more inclusive- the more data the merrier, drag everything out of all authors’ lab notebooks. Others are very limiting- essential data and files in appropriate for print only and anything else must be incorporated into the main body of the manuscript or cut out completely.

Preparing figures starts with high-quality data.

Images should be of sufficient resolution. Any adjustments of brightness and contrast must be made to the entire image; adjusting selective portions is unethical data manipulation and scientific fraud. Cropping is OK, but again beware of excessive image manipulations. They are usually an indicator that you need to repeat the experiment to obtain the necessary data.

Experimental data should be free of technical errors or other artifacts. The results should come from experiments as described in the methods section. Consistency in following experimental protocols (and including all of those details in your notebook) should be standard lab practices. Controls must be performed for each experiment so that the results can be properly interpreted. As you evaluate the figures you have made from your data, check again to see if all necessary controls have been included. When in doubt, don’t skimp on this- repeat the experiment with the proper controls. Your co-authors and reviewers will likely eventually tell you the same thing.

Your data should also be repeated enough times to be statistically relevant. Note that this does not mean you repeat an experiment enough times until you get the data you want. This ‘cherry-picking’ is another unethical manipulation of data. Unfortunately, this type of fraud is the most difficult to catch by the peer-review system. Reviewers have no way of knowing that you have a hundred other experimental trials with contradictory data in your lab notebook. Scientists must have the integrity to accurately present their results and have legitimate justifications for excluding some data (altered variables, confounding variables, improper controls etc). It is not always possible to show all repetitions of an experiment and in some cases (like gels) it is not even feasible to average the results. Showing ‘representative data’ (a single instance of the most common result) is perfectly acceptable, but it should be just that- representative of your average results.

Don’t pursue perfect data at the expense of integrity. The rising standards of scientific work and competition for rewards based on that work create an enormous amount of pressure to compromise your integrity for the sake of publication. RESIST! Research fraud undermines our entire enterprise. Biological systems are inherently complex and imperfect- we should not expect results to be simple and pristine.  Control for what you can when you can, but do not otherwise force data to yield a certain result.

Putting together figure files

Usually your data will consist of images or graphs. These electronic files must be edited to include the raw data as well as appropriate labels. The simplest way of doing this is to drop the images into a PowerPoint slide to assemble all the necessary parts. Text boxes can be used to add labels. Lines and arrows can be added to draw attention to certain features. All labels and features of your figures should be properly aligned using the automatic tools for doing so. More complex figures consist of multiple parts that are designated by letters (Ex: Figure 1A and Figure 1B), and these letters can be added as text boxes. Journals tend to have preferences for the exact labeling details (fonts, sizes etc) and the instructions to authors will have this information. Make sure you read this information carefully and apply it consistently across all figures. Don’t use Arial capital letters to label the parts of Figure 1, Calibri Roman numerals for Figure 3 and lower case Times New Roman on Figure 5. You’re not in cloud cuckoo land. Editors, reviewers and other scientists appreciate consistency.

Remember that in the final manuscript format, the sizes of all labels and images will be considerably reduced. Make sure that your figure as submitted in manuscript form is sufficiently large so that it is still interpretable at a much smaller size. Any lines on graphs should be of sufficient thickness so as not to disappear or lose their pattern upon reduction. Note that it is generally easier to number samples like gel lanes, mulitpart images, etc than to write out the full sample description in the figure. Save the full sample names and descriptions for the figure legend.

When available, move up in the food chain to a program like Adobe Photoshop or Illustrator or Corel Draw to put together figure images. These programs have a steeper learning curve, but offer more sophisticated options for putting the figure file together and saving it as a high resolution image. For many journals, your figures must be submitted as image files (usually .tiff) or as PDF pages. Most journals use the manuscript submission phase as their quality control phase, meaning the files you submit for review must be of sufficient quality for the manuscript proof. Speaking of higher quality software, programs like OriginLab and Kaleidagraph are much better at generating image quality graphs than Microsoft Excel.

Color vs. Black/White or Grayscale Figures

Journals will typically charge you more to print color figures over black and white or grayscale images. (Oh, so yeah, if you didn’t get the memo, the authors typically pay publication charges to cover the printing and/or access for the published work. But then again, if you’ve gotten this far, you’ve realized you’re not in science for the money.) When possible use black and white or grayscale figures. If graphs become too complicated in monotone, try breaking up the number of samples shown on the same axis. Of course, you shouldn’t completely eschew color. Use it when it is most appropriate to distinguish samples. For example, it’s not that big of a deal to show a Coomassie-stained gel in black and white, but pictures of Arabidopsis showing wild-type and mutant plants with varying degrees of pigmentation should definitely be in color. Finally, as part of the ‘use color judiciously rule’, stick with the basic colors (8 crayola box, not the 196) so that there are no incompatibilities or unexpected shifts in tone when transferring files or changing file-types. Also keep in mind that there is ~10% prevalence of red-green colorblindness, so avoid using these colors together to differentiate between key samples. (Hey, after #TheDress this week, maybe you should just avoid color altogether.)

The figure heading, title and legend

Each figure should have a heading as defined by the journal (Ex: ‘Figure 1.’ ‘Fig. 1’ or ‘Figure 1:’). Each figure should also have a title, the formatting of which may be explicitly defined by the journal. It may be required to be in the form of a complete sentence or just a concise phrase; it may be required to be in bold or italics to distinguish it from the legend. The legend should tell the reader what they are looking at. It is not necessary to include lengthy procedural details, but it is useful to mention the name of the experiment and any details about treatment or sample preparation useful for interpreting the data in the figure. It should define all parts shown. Every sample or label on the figure must be defined in the legend.

Other random and lesser commandments

  1. Thou shalt be consistent across all figures.
  2. Thou shalt not use yellow for graph lines.
  3. Thou shalt include error bars.
  4. Thou shalt have elements sized appropriately relative to one another.

Include your figure and figure legend tips and lesser commandments below.

Johnna
Literature Searching, Reading, Organizing

This is part of a tutorial series I’m writing for my students. This series of posts compiled on the page A Beginner’s Guide to Writing Scientific Manuscripts. This post was also featured on the addgene.org blog.

Science writing first requires a lot of science reading.

Any scientific manuscript will require numerous other references to scientific literature to substantiate the facts upon which it builds. This means you have to become familiar with a body of literature related to the topic. Finding reliable references and sorting out what they mean is no small task. As a scientist, it is useful to make literature searching and reading a regular part of your routine. Set a goal to read a certain number of papers each week to keep up with the research in your area. When you are in ‘writing-mode’ for a grant or a scientific manuscript, the reading will likely be more intense, but it is a general good practice to keep up with the scientific literature a little bit at a time.

Searching for Literature

My go-to search engines for finding scientific literature are Google Scholar and PubMed. You can search key words, titles, authors, year, narrow by article type (review, patent, clinical study, research article etc). There are also numerous options for narrowing down your search and sorting the results (relevance, dates etc). The links for the titles can generally take you to the full text of the article (beware of paywalls if you’re not on a network with an institutional subscription). If based on the abstract of the article, you’d like to get a look at the full text, but you’re on the wrong side of a paywall, you could always e-mail the corresponding author to request a copy. For a quicker response, tweet the reference with the hashtag #ICanHazPDF with email [at] domain.com and someone out there on the interwebz with access will send it to you.  One of the biggest issues you will likely have is sifting through the long list of titles for something that is actually useful to you. When embarking on a new literature search, try to find a recent review article to give you an overview of the topic and point you to relevant primary research articles. Then just start reading and following citations through the literature until you have all of the information you need.

https://scholar.google.com/

http://www.ncbi.nlm.nih.gov/pubmed


Reading Primary Research Literature

The best way to understand scientific papers is to practice reading them. There’s a learning curve for the jargon and background in your field, but sometimes papers are also just crappily written. By nature, scientific literature is information dense and since it continually builds on previous studies, the reader always enters in the middle of the action. If the paper is well-written, the abstract should give you a sense of the importance of the work, the research that was done and what it means. The introduction should give you just enough information to allow you to understand the research question that will be addressed. In primary research papers, the introductions should be fairly focused. Consult a review article for a broader scope of what’s going on in any given research area. Unless you are looking for a particular protocol or are trying to replicate an experiment, the methods section probably won’t get much attention reading through an article for the first time. The first time through, just get an idea of the techniques used in the research, but wait to sort out any of the finer details until you see the figures in the results section. As you’re sorting through the results section, this is where the authors are showing you their data. They should explain some of the rationale behind the line of experiments, what data they collected and what it means. There should be some connection or flow among the figures and results that ultimately builds up to (an) overall conclusion(s). In some articles, the data are presented to build a case for a certain model or overall conclusion. In others, the experiments are geared towards eliminating possibilities until the results focus in on a particular conclusion. Many papers aren’t always written this way and there is a greater burden on the reader to interpret the results to see if it leads you to the same conclusion. Personally, I like papers that can end with some sort of model (cartoons are appreciated) to visually sum up all of the conclusions. In any case, the reader should give a critical eye to all results in the relation to how they are supporting the conclusions. Look at the figures and write down your own results; are they the same as the description the authors give? Ask yourself if the results mean what the authors say they mean. Could there be any other possible interpretation of the results? Then think deeper about the data they are showing. Are those experiments the best way of figuring out what’s going on? Is the data of sufficient quality (error bars, statistics, clarity in images etc)? Did they perform all of the appropriate controls? Refer back to the methods section for finer points of the protocols. Are there any red flags about how the work was performed that could influence the results? The peer-review process is not perfect, so even though it is science’s way of validating work prior to publication, it doesn’t mean that there are no mistakes or misinterpretations. After all, the science was performed, written and evaluated by humans.

Keeping up with the Literature

There are a few ways to make sure you are keeping up with the literature in your field of interest. Set aside some time each day or week to at least scan the titles of what’s going on in your research area. Set a goal for paper-reading, even starting out at 1 paper/week will be useful. Check out the hashtag #365papers on Twitter for inspiration and accountability. There are a few different ways to automate the process as well. Sign up for eTOC (electronic table of contents) alerts from journals you read often. The contents of each issue will be delivered to your inbox as soon as they are available. Give them a quick scan for interesting key words and download what seems interesting or relevant. Harness the power of the Google search engine and sign up for Google Scholar alerts. Based on keywords that you provide, Google Scholar will send you daily updates with relevant literature.

Organizing Literature

As a scientist, you will begin to amass numerous downloaded PDF files of research articles. It’s your own digital library for the full-text version of useful papers. For many, this collection is purely electronic. Gone are the days of file cabinets filled to the brim with reprints and papers with scribbled notations in the margins. If you prefer, printing and hand-writing notes is still possible, but not feasible for every paper you will ever read. So, you need to come up with an organization system that works for you. I have a folder where I dump all of my papers and they all have filenames (year first author name). It’s rudimentary, but it works for me. I can often remember which paper I need to open, but when I can’t it’s an easy search. Writing this tutorial has shown me that I’m still in the dark ages with respect to my organization strategy. There are a number of software options for helping you manage your own digital library. Check out Papers, Mendely, CiteULike. These programs offer more options for searching and sorting your own digital library as well as some integration with internet-wide literature searching.

Give your favorite searching, reading and organization tips in the comments below. Please weigh in on a literature organization/management software preference because I’m embarrassed to have not gotten with one of these programs yet. #OldSchool #AtLeastItsNotPaper

Johnna

Writing the Materials and Methods Sections

This is part of a tutorial series I’m writing for my students on scientific manuscript preparation. This series is compiled on the page A Beginner’s Guide to Writing Scientific Manuscripts.

This section should include information on every experimental procedure used in the work. You don’t have to include experimental details of everything that was in your lab notebook or all of the optimization work you did for the project. Yeah, readers don’t care about the two-years’ worth of failed protein purification methods in your notebook. You will only include the short paragraph of what did finally work. Refer to your figures. Whatever experiments yielded data that is ultimately found in your figures should have details in your Materials and Methods section. If certain reagents were critical to completion of the experiments, then include your sources for them (commercial or donations from other labs). The Materials and Methods section is written in the past tense without the use of personal pronouns. It may seem awkward to get into this point of view, but there is an omniscient perspective from which your methods can be written. I’m not sure where this convention originated, but remove yourself from the experiment and it seems more legitimate.

Subdivide this section into useful parts. This kind of organization also helps the reader pinpoint details for replication or evaluation of experiments. Often readers will be looking at your work to perform similar experiments or repeat your work.

It’s not exactly a protocol, but it should be complete. You don’t have to tell your readers every step of a protocol, but it should be complete enough for someone else with comparable training to replicate. The literature varies widely in the usefulness and clarity of methods descriptions. For more complex procedures, authors are often contacted directly for lab protocols or additional information not included in the materials and methods section. As methods have become more complex, fewer details are included. This is especially true of molecular biology work. Typically primer sequences are given and specific vectors are mentioned, but it can be especially irksome to figure out others’ cloning construction strategies. Usually, though, this information can be obtained directly from the authors. In general, I would err on the side of completeness (vs. concise) because this makes it easier for your experimental strategies to be evaluated and replicated. This strategy can run afoul of the journal’s character limits, but in this age of online publication, supplemental information is allowed. You can write a ‘Supplemental Methods’ section which will be available online only and can be as long as you’d like.

Referencing previous literature is a convenient way of being concise. It is acceptable to say something like, “This experiment was performed as in Reference (1).” However, if you go this route, make sure that the reference you are citing in this case does have the necessary information on experimental details. The scientific literature is infamous for pulling this trick only to reference yet another paper that says “This experiment was performed as in Reference (2).” You may have to follow this rabbit hole back a couple of decades before you find any real useful information on performing the experiment. (This is a personal pet peeve of mine that just makes me feel stabby when I encounter this nonsense.) So save your readers some trouble and either include the necessary info or cite a direct source. For many labs, there are standard references and descriptions for routinely used methods that appear in almost all of the manuscripts. It’s fine to revert back to previously published articles to see how things were worded and what references were cited, but it’s always a good idea to verify these references yourself. Otherwise, a mis-referenced citation will be propagated many times over. (This is also a good practice for any citation anywhere in a manuscript- to make sure the reference is really saying what you think it does.)

Offer your pro-tips for methods-writing in the comments section below.

Johnna